
In this tutorial I’ll explain how to monitor BI BigQuery costs per user, using Google Data Studio. You will learn how to build a report that shows costs associated with Big Query users, and the frequency of usage, using a bespoke Google Data Studio dashboard.
You can simply copy the template from here or read this tutorial if you want to learn how to do it yourself. In this article, I will explain how to set up BigQuery cost monitoring dashboard.
What you’ll need:
- Google Cloud Platform (GCP) account
- BigQuery
- Data Studio
I’ll show you how to use BigQuery logs to pull actual report labels into this fantastic dashboard.
Project outline
- Go to Cloud Audit Log for BigQuery and create a sink. In this way you can export any logs for further analysis. Very useful.
- Create BigQuery dataset to work with
- Create a SQL query to calculate costs for each report being run
- Create IAM roles for your users so they can see the data
- Create billing alerts and set up notifications
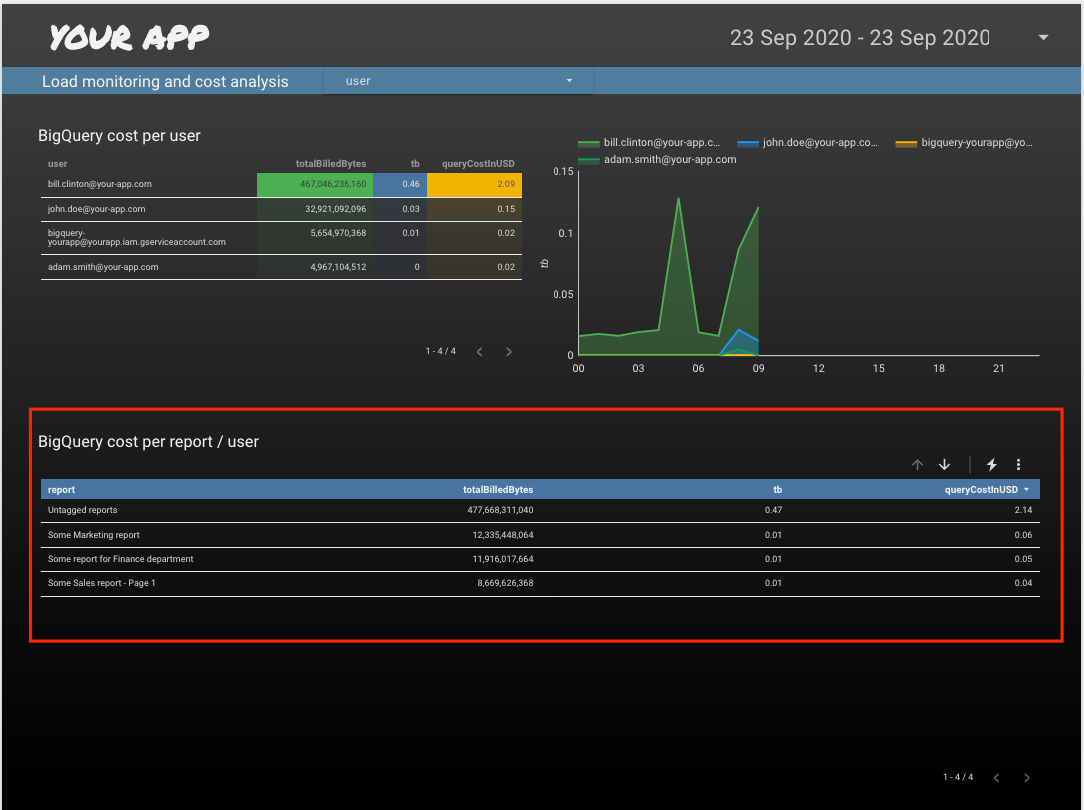
In this project, you will learn how to create a beautiful cost monitoring dashboard where you can see your BigQuery costs associated with each Data Studio report allowing you to go deeper and beyond basic dataset level reporting in Google Cloud Billing.
Thanks for reading and let me know if you have any questions.